


توضیحات
Learning Technical Analysis is never easier like this!
Learn about charts, chart patterns, indicators & overlays to trade and invest in the Stock Market, Cryptocurrency, Forex or any financial market with confidence.
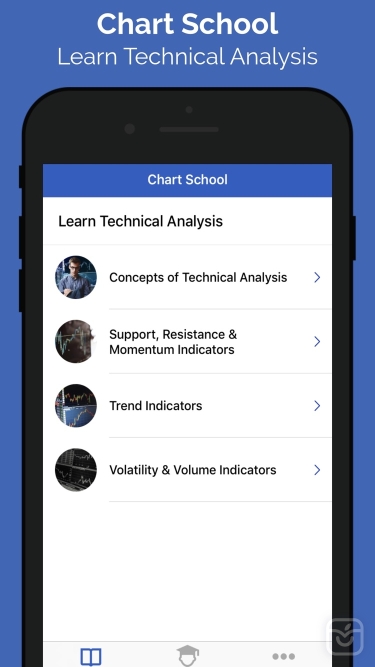
Courses to learn:
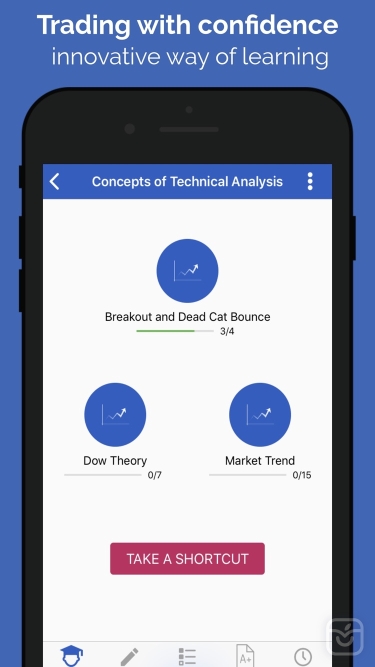
- Concept of Technical Analysis (Breakout, Dow Theory, ...)
- Support, Resistance & Momentum Indicators: (Money Flow Index, Stochastic Oscillator, ...)
- Trend Indicators (MACD, OBV,...)
- Volatility & Volume Indicators (Bollinger Bands, Donchian Channel...)
- How Does The Stock Market Works (3 Video Lesions)
This app organizes a lot of difficult information into small courses to be able to finish them in just 1 or 2 hours.
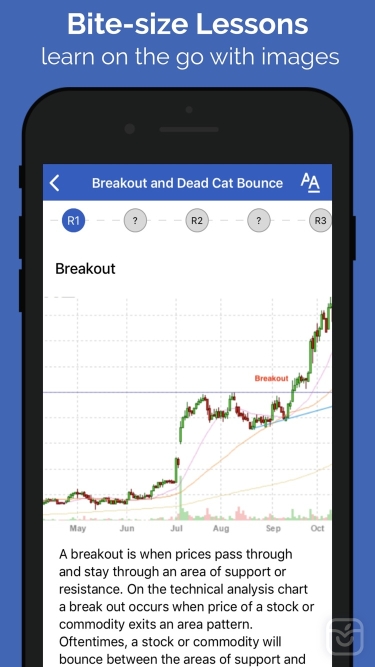
In each course, you learn at your own pace with bite-size lessons followed by review questions. This is an innovative & proven method for the best outcome.
You can also use the Crypto Tracker by BitScreener app and the website BitScreener.com while learning these courses for the best result. BitScreener offers advanced & real-time charts for 2000+ coins with a large number of technical indicators & overlays.
Stay tuned for new features coming, such as Stock & Cryptocurrency simulator & virtual trading.
Request new features & report bugs at support@bitscreener.com.
تغییرات نسخه اخیر
توسعه دهنده
BITSCREENER PTE. LTD.